Dashboard & API
Dashboard uses Preact. TypeScript sources live in src/dashboard/; committed
flat src/dashboard.js stays deployable. Help remains plain JavaScript.
Endpoints
GET /s.js— the browser beacon (~2.8 KB minified). Config comes off the script tag:data-site(optional on a mapped custom domain) anddata-dev="1"to collect from localhost, which is otherwise skipped.GET /e?s=<site>&v=<base64>— beacon, sent as a 1×1 gif-pixel image request.v = base64(encodeURIComponent(JSON.stringify({p,r,l,ls,tz,…}))). Browser/OS are derived from the requestuser-agentheader server-side; the client UA is ignored. Always answers with the same gif, for every input.GET /a?s=<site>&v=<base64>— desktop-app ping, using the same payload encoding and gif response as/e. It bypasses browser bot classification and writes app-specific counters only. The client is responsible for sending at most one ping per install per UTC day.POST /s?s=<site>— explicit desktop-app survey submission. JSON body capped at 2 KiB; 204 after one response row is stored. An unknown site gets the same responses but nothing is stored, so/sdoes not reveal which sites exist. Invalid JSON or survey version returns 400, oversized bodies 413, and exhausted process-local IP buckets 429 withRetry-After(three tokens per hour).GET /surveys?site=<id>&sv=1&from=YYYY-MM-DD&to=YYYY-MM-DD&cross=os— authenticated response counts, NPS, comments and per-option cross-tabs.svdefaults to 1; omitted dates include all stored days.crossacceptsos,dv(model),v(app version) orf(short/fullform; the summary also carries ashortcount). Missing context appears asunknown.GET /surveys/export?site=<id>&sv=1&from=…&to=…— authenticated JSON response pages:{site, sv, responses, cursor}. Each response has its UTCdayplus validated payload; pages contain at most 100 rows. Pass returnedcursoron the next request, keeping site/version/date filters unchanged;nullends pagination. Internal row ids are excluded. Survey reads returnCache-Control: no-storeand use the same site-token boundary as/stats.GET /stats?site=<id>&day=YYYY-MM-DD— JSON counts.daydefaults to today (UTC). Range:&from=…&to=…(inclusive) merges into totals, read in parallel. Add&series=1for a per-day series ([[day, pv, uv, sessions, bot, app], …]). 401 on a bad token or an unresolved site.GET /sites—[{id, host}], admin token only. Powers the dashboard's site picker; a per-site token gets 401 there and you type the id instead.GET /badge?site=<id>&days=30— an SVG counter for a README, the one unauthenticated read. Opt-in per site viaBADGE_SITES; see Badge. 404 for a site that did not opt in and for one that does not exist — the two are indistinguishable on purpose.GET /dashboard— the analytics UI.GET /help— guided setup. Both are served ungated: they hold no secret, the token is typed into the page, and a new operator has to reach/helpbefore they have a working token. Their assets (/dashboard.css,/dashboard.js,/da-common.js,/help.js) and the vendored uPlot (/vendor/uPlot.iife.min.js,/vendor/uPlot.min.css) are served the same way.GET /—ok.
Desktop-app payload (/a)
v decodes to one JSON object. These are all recognized payload fields; unknown
fields are ignored. s is the normal allowlisted site selector, not a payload
field. Host mapping and the single-site fallback work exactly as they do for
/e.
| payload field | accepted value | stored dimension | dashboard display |
|---|---|---|---|
os | non-empty string, clamped to 128 characters | app_os | app_os breakdown |
ov | lowercase OS bucket such as windows-11, macos-26, ubuntu-24.04, arch, or unknown | app_os_version | app_os_version breakdown |
tz | UTC±HH:MM or unknown | app_tz_offset | app_tz_offset breakdown; selecting a row opens current matching IANA zones |
v | release version MAJOR.MINOR.PATCH | app_version | app_version breakdown |
dv | comma-separated device ids; first eight non-empty values, each clamped to 128 characters | one app_device count per id | app_device breakdown |
country | locale tag or region, such as sk-SK or SK; final 2–3 letter segment is uppercased | shared country dimension, unless a CDN country header is present | country breakdown |
Every request also increments app["_"], even when v is missing or malformed.
This powers the app pings KPI and trend line. For one day it is a
distinct-install count only when the client honors the once-daily contract; for
longer ranges it is the sum of daily pings. It never increments pv, uv,
sessions, or bot counters.
Auth
Authorization: Bearer <token> — what the dashboard uses, since it keeps the
secret out of access logs — or ?token=… for curl convenience.
The tenancy boundary: /stats, /surveys and /surveys/export check the token against the resolved site
only, never against the set of all tokens.
Survey payload (POST /s)
The wire body matches the app's reviewed JSON:
{
  "sv": 1,
  "v": "0.21.0",
  "os": "macos",
  "ov": "macos-26",
  "dv": "mirabox-293s",
  "a": { "rating": "4", "found": "ai-claude", "nps": "9", "want": ["widgets"] },
  "c": "Useful app"
}
sv must be a positive safe integer. Answer keys and option ids match
^[a-z0-9-]{1,32}$; values are strings or arrays of at most 12 distinct valid
ids. The app owns each version's question bank; the collector validates shapes
so future banks need no collector update. Invalid answer/context shapes and
unknown top-level fields are dropped. All questions may be skipped.
v accepts numeric MAJOR.MINOR.PATCH; os is macos, windows, linux or
unknown; ov uses the same OS-bucket shape as /a. dv retains at most eight
distinct model ids matching ^[a-z0-9][a-z0-9_-]{0,31}$. Optional c is trimmed
and capped at 280 characters. Bodies are limited by actual UTF-8 bytes even
without Content-Length. See the survey data model
for row storage, retention and rate-limit scope.
What the dashboard renders
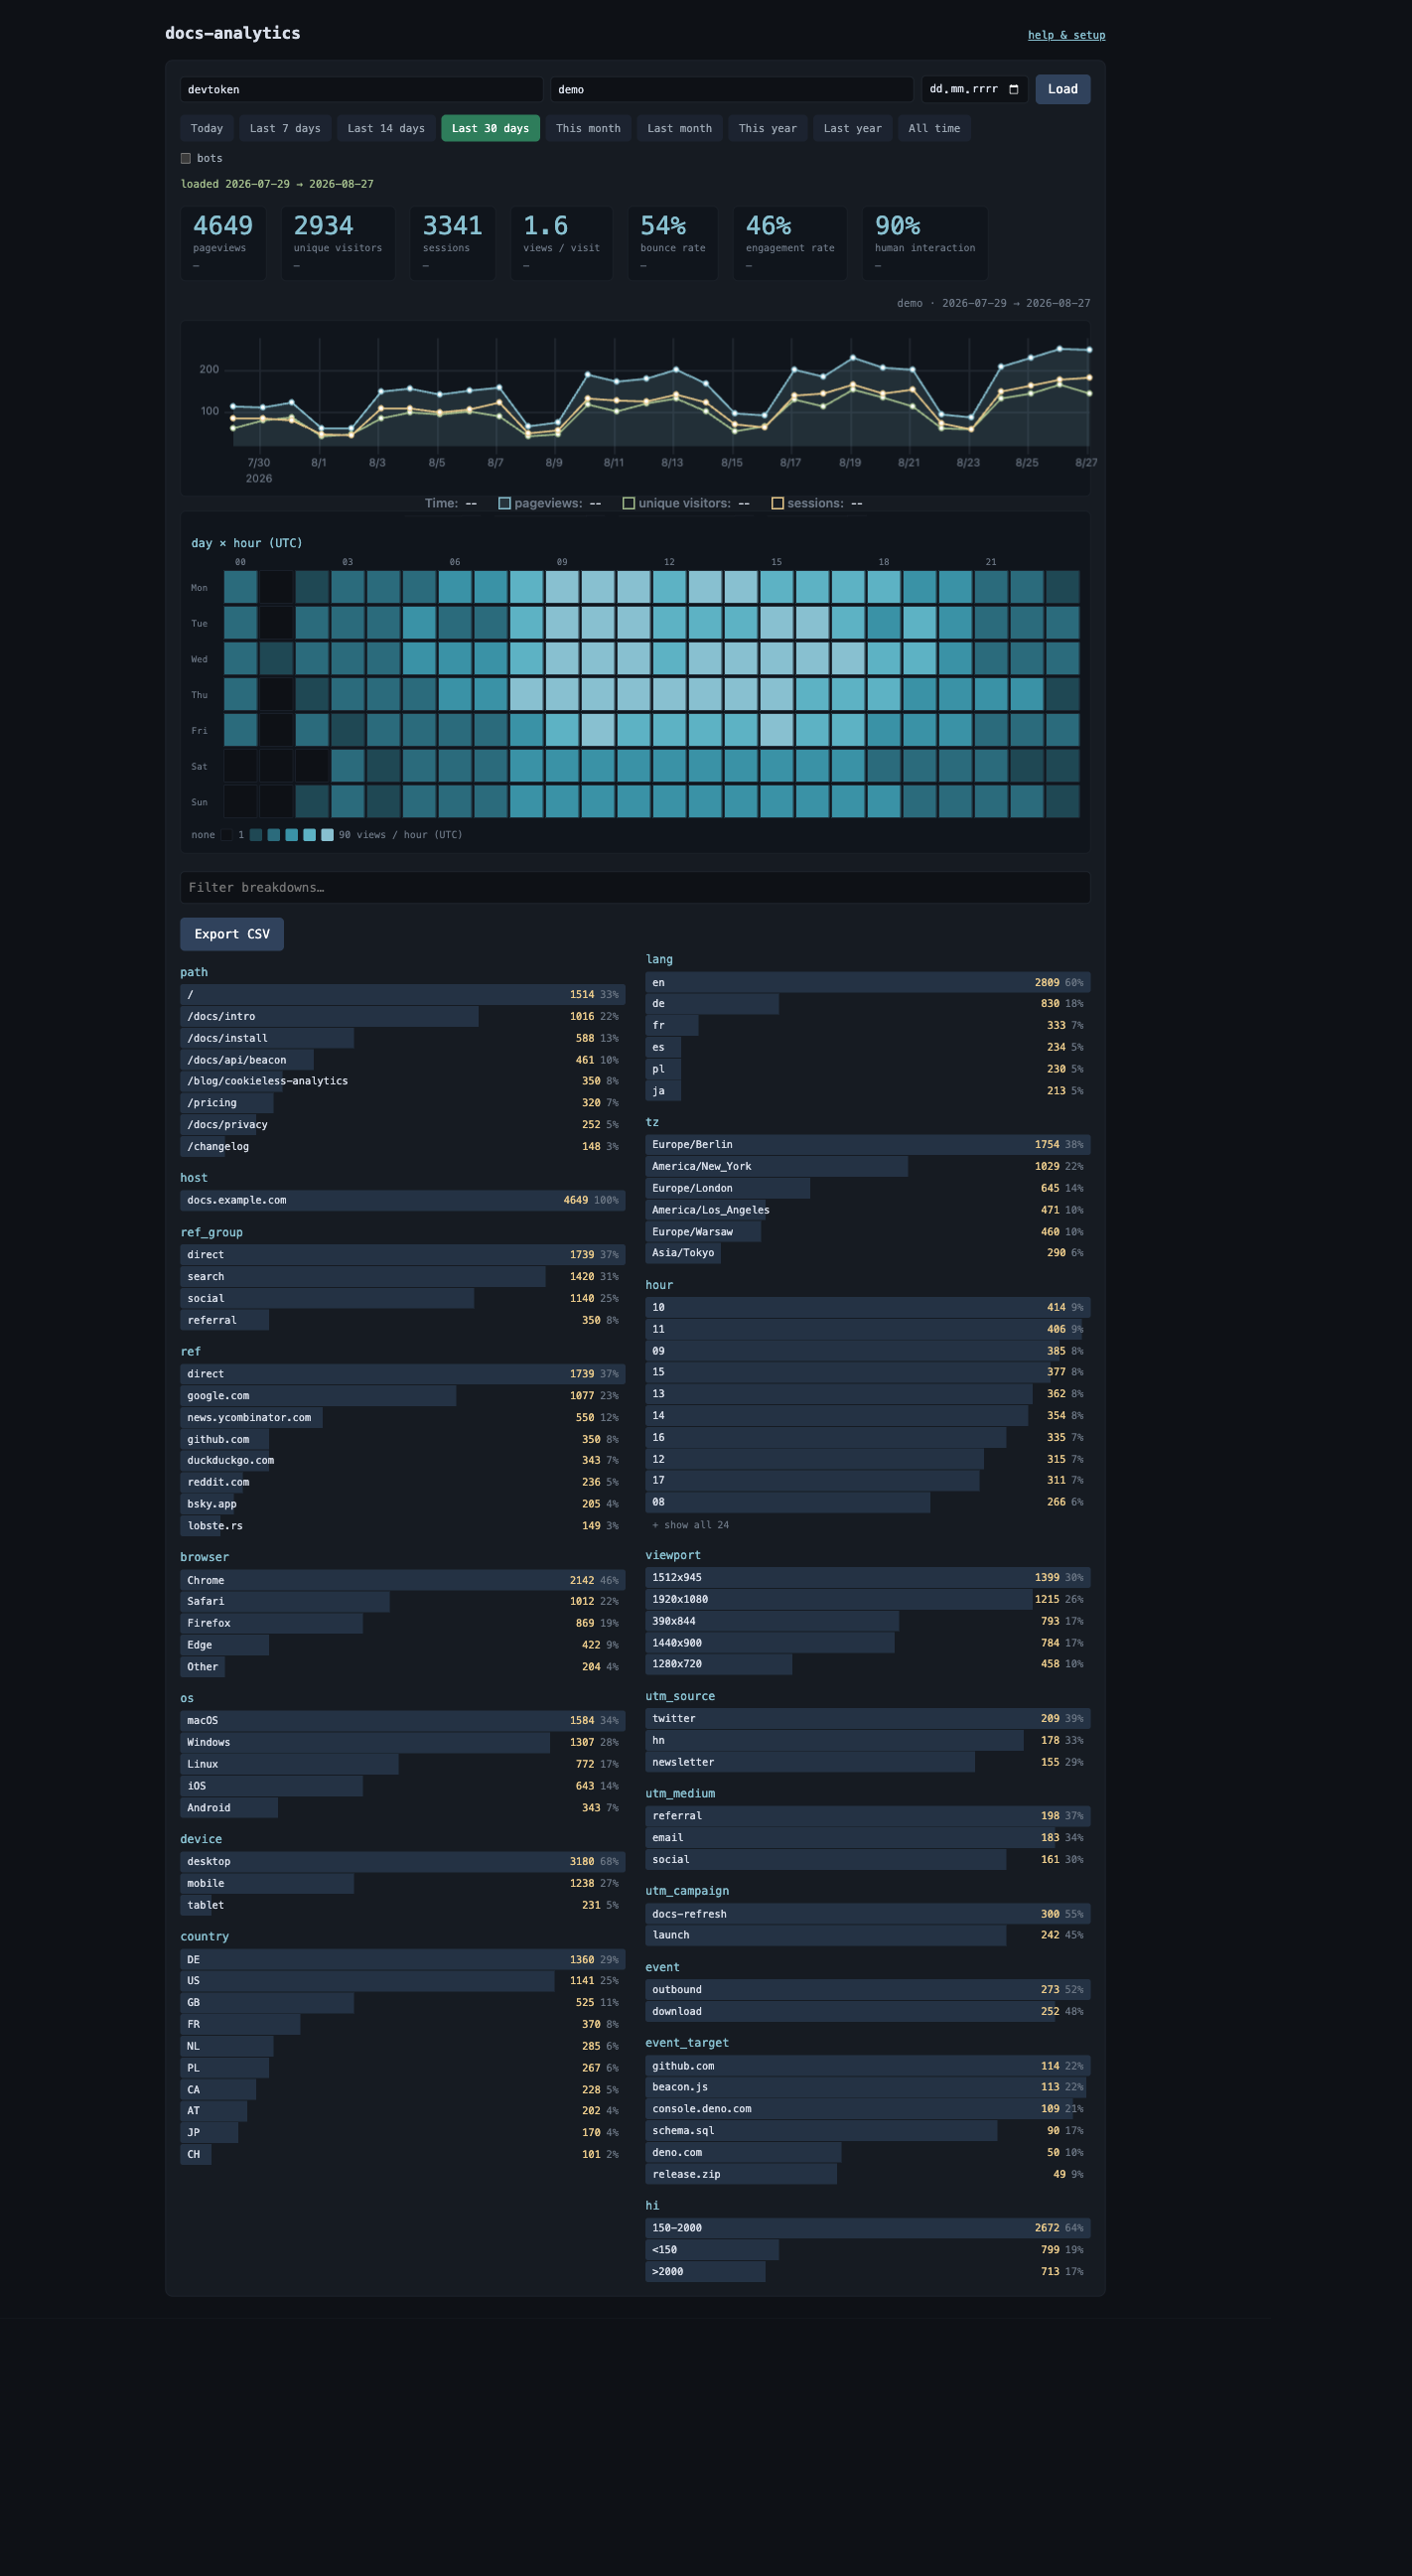
Last 30 days over seeded demo data — deno task demo reproduces this exactly,
with no real traffic. The deltas read — because the seeded range starts
exactly 30 days back, so there is no prior period to compare against.
- KPI tiles — pageviews, visitors, sessions, views/visit, bounce rate, engagement rate, human interaction, and app pings when present, each with its delta against the prior period of equal length.
- Trend chart (uPlot, vendored — no CDN) — pageviews / visitors / sessions,
app pings when present, plus a dashed
botsline when show bot traffic is on. - Day × hour heatmap — rendered from the
dowhourjoint counter, the one pairwise dim in the schema (why). - Breakdowns — every dim in card or bar view, top 10 per dim behind a show all toggle, count + share of that dim's total on each row. The filter box searches every value, capped or not, and hides dims with no match. App timezone offsets open a map and current matching IANA-zone list.
- CSV export — always includes the bot dims, regardless of the toggle.
- Surveys tab — shares site, token and date controls; selects survey
version and OS/model/app-version grouping. Shows response totals, per-option
counts and shares, NPS, one-question cross-tabs and day-only comments. Multi-
model responses appear in each model group. Export JSON downloads all
matching response pages.
deno task demoseeds surveys underdemo-app.
Everything comes from one GET /stats?…&series=1 response. The period selector
and the bot toggle re-render the loaded payload rather than refetching.
Bot traffic is off by default (remembered in localStorage). Turning it on
is strictly additive — bot hits never write pv, so
pageviews/visitors/sessions/bounce are bot-free either way
(why).
/help
Setup, with a Check button on every step rather than a description of what should happen:
- collector reachable —
GET /returnsok; - site id + token — one
/statsprobe, which 401s both for a wrong token and for a site that token does not own; - script tag installed — the snippet is rendered prefilled with your site id and this origin, and the check looks for pageviews in the last two days;
- real traffic — the
hostdim contains the origin you pasted the tag on; - a second project — the other site id is live and readable.
Every check uses an endpoint that already exists, so nothing here can drift from what the server does. The page also hosts the test-beacon and Seed 30 random tools, which is what makes steps 3–4 checkable before real traffic arrives.
curl smoke test
BASE=http://localhost:8123                 # or https://stats.<yourdomain>

V=$(deno eval 'console.log(btoa(encodeURIComponent(JSON.stringify(
  {p:"/docs/intro",r:"google.com",l:"de-DE",tz:"Europe/Berlin"}))))')

curl -i "$BASE/e?s=demo&v=$V" \
  -H 'user-agent: Mozilla/5.0 (Windows NT 10.0) Firefox/126.0'
# → 200 image/gif;  Firefox / Windows / de

curl -s "$BASE/stats?site=demo&token=devtoken" | jq .
A custom UA is the point of doing this with curl — it exercises parseUA in a
way the browser cannot.